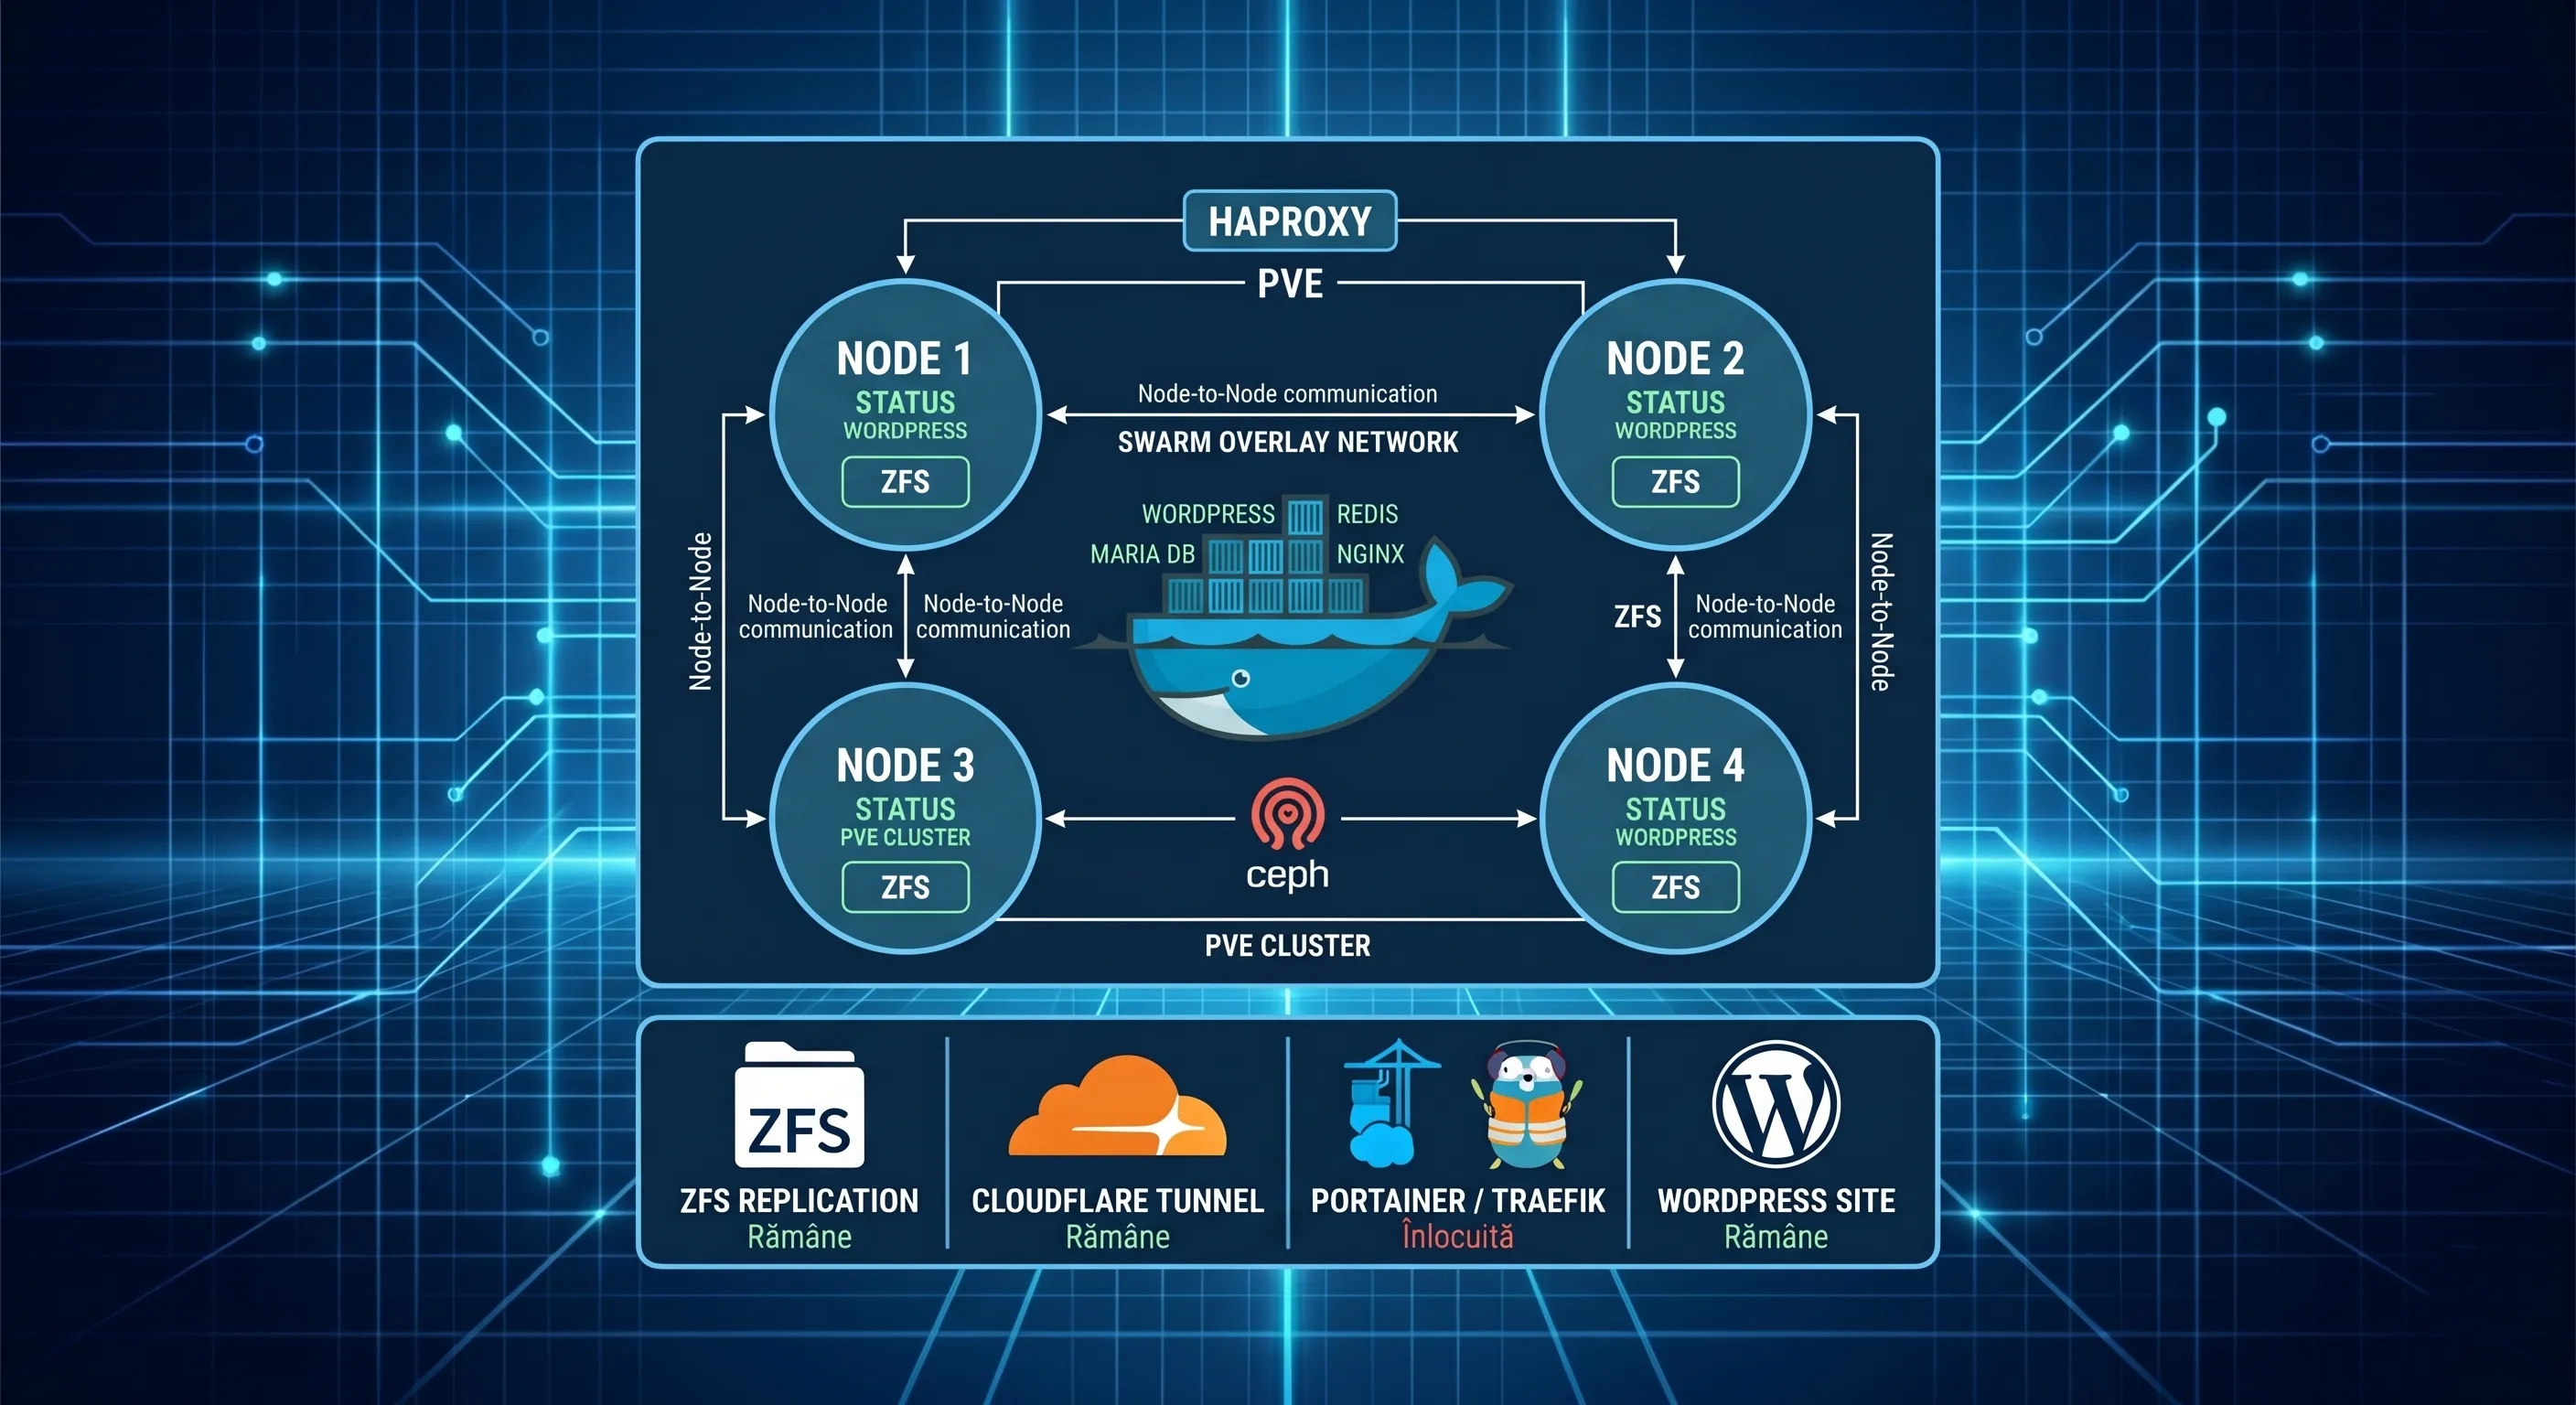
This series teaches you how to transition from classic hosting to an advanced architecture, explaining step-by-step how to implement your own Docker Swarm cluster to run a fully scalable WordPress site.
🔹Episode 0: Moving to Enterprise Level and Project Architecture
„We built a tank together (Proxmox HA). Now, instead of putting a classic engine in it, we’re installing a rocket engine: Docker Swarm.”
Welcome to a new chapter of our journey. We are leaving classic control panels behind and building our own container infrastructure.
What we keep from the “From scratch to a complete site” series (The mandatory foundation):
For this new project to work, we will rely on the solid infrastructure built in the previous series ( https://tech.renuka.ro/en/pt-portfolio/from-zero-to-a-complete-website/ ). If you haven’t completed those steps, I recommend reviewing the following chapters:
- Episode 0: The Foundation. Proxmox Cluster and High Availability (HA)
- Episode 1: Choosing and buying a cheap domain – Namecheap –
- Episode 2: Domain configuration in Cloudflare + Free SSL
- Episode 3: Invisible Architecture. Cloudflare Tunnel and ZFS Replication
New Project Structure (The 6 Indestructible Episodes):
In this project, we will build an Enterprise architecture step-by-step, logically distributed over the following episodes:
- Episode 0: The Software Foundation. Installing Docker Swarm (The cluster’s Operating System).
- Episode 1: The Command Center. Installing Portainer (Visual management of the cluster).
- Episode 2: Connecting to the Internet. Reconfiguring Cloudflare Tunnel (Access and Direct Routing).
- Episode 3: The Site Itself. Launching WordPress (The Engine) and MariaDB (The Vault).
- Episode 4: Maintenance Tools. Adding FileBrowser and phpMyAdmin (The Intervention).
- Episode 5: Monitoring and Survival. Grafana (Health) and Duplicati (External Backup).
🔹Preamble: The Software Foundation. Installing Docker Engine and Initializing the Swarm
Our applications need a stable “ground” to be built upon. That ground is the Docker engine, which we will install on two strategic nodes: your physical Ubuntu machine (Manager – .111) and the Proxmox virtual machine (Worker – .112), which benefits from ZFS replication between pve1 and pve2 for maximum availability.
⚠️ CRUCIAL NOTE: Environment cleanliness. Do not install Docker over the old project (CyberPanel) to avoid conflicts. We will use a completely fresh environment.
a. Creating and Preparing the “Home” for Docker
In Proxmox, we created the VM with ID 201, named docker-worker-01 (Ubuntu Server, 4GB RAM, 2 CPU Cores).
The Golden Rule (ZFS Replication): Immediately after creation, we set the replication to every minute to the secondary node. To finalize the OS preparation, run the following commands on the new server:
# System update and Proxmox guest agent installation
sudo apt update && sudo apt upgrade -y
sudo apt install qemu-guest-agent -y
sudo systemctl enable --now qemu-guest-agent

# Timezone synchronization (Bucharest)
sudo timedatectl set-timezone Europe/Bucharest
b. Installing Docker Engine
Once the systems are ready, we proceed to install the Docker engine. This procedure is executed on both the Manager laptop (.111) and the new Worker VM (.112):
# Downloading and running the official Docker script
curl -fsSL https://get.docker.com -o get-docker.sh
sudo sh get-docker.sh

# Applying permissions for the current user
sudo usermod -aG docker $USER
newgrp docker
c. Creating the Cluster (The Great Docker Swarm Union)
We transform the two entities into a single organism. The first step is done on the Manager (.111):
# Initializing the Swarm cluster
docker swarm init --advertise-addr 192.168.1.111
Copy the docker swarm join --token... command generated by the manager and run it in the console of the docker-worker-01 (.112) server.
d. Verifying the Cluster
Go back to the laptop (Manager) and verify if the “worker” has successfully joined:
docker node lsIf both nodes appear with the status Ready, congratulations! You have a functional Docker Swarm cluster.
🔹Intermediate Episode (0.5): Cleanup and Name Uniformity
Before moving on to configuring external access, we take a short break to ensure our infrastructure meets Enterprise standards. In the previous steps, we installed the system on a generic user (renuka), but in a professional cluster, we want each machine’s identity to reflect its role.
Why are we making this change?
- Clarity: It is much easier to identify a node as
worker-01than by the name of the person who installed it. - Scalability: We are preparing the ground for when we add
worker-02,worker-03, etc.
Uniformity Commands (Executed on the Worker – .112)
We will change the server’s “ID name” (Hostname) to match the name in Proxmox. Run these commands in the secondary node’s terminal:
# 1. Change the machine name in the system
sudo hostnamectl set-hostname docker-worker-01

# 2. Update the internal network file (replace the old name "renuka" with the new one)
sudo sed -i 's/renuka/docker-worker-01/g' /etc/hosts

# 3. Apply the change (requires a logout/login or restart)
sudo reboot
What has changed? After the restart, your prompt is no longer renuka@renuka, but renuka@docker-worker-01. The Docker Swarm cluster will automatically pick up the new name in the list, providing a clear view of your resources.
Done! We now have a clean foundation and are ready to open the gates to the Internet in Episode 2.
🔹Episode 1: The Command Center. Installing Portainer
Our Docker Swarm cluster is now alive, but currently “blind”. To efficiently manage resources without typing endless commands in the terminal, we need a central control point:
- Portainer (The Command Center): The graphical interface from which we will manage containers, volumes, and networks across all nodes simultaneously.
a. Building the “Highway”: The Overlay Network
Before apps, we create an overlay network. This allows containers on different servers (Laptop and Proxmox) to communicate securely, as if they were on the same switch. Run on the Manager (.111):
# Create the main public network of the cluster
docker network create --driver=overlay swarm-public
b. Installing Portainer Stack
In Swarm, we install Portainer as a Stack. This will automatically launch an “Agent” on each available node to collect technical data. We run on the Manager:
# Download the official Portainer configuration for Swarm
curl -L https://downloads.portainer.io/ce2-19/portainer-agent-stack.yml -o portainer-agent-stack.yml

# Launch the stack in the cluster
docker stack deploy -c portainer-agent-stack.yml portainer
⚠️ Security: You have 5 minutes to configure the admin user at the address https://192.168.1.111:9443. If it expires, reset the service with: docker service update --force portainer_portainer.
c. Finalizing the interface and cleaning environments
After logging in, if you notice an environment named “primary” with an error, it is recommended to delete it from Settings -> Environments. The functional environment will be the one created through the connection to the agents, showing you the full power of your cluster under a single name: Swarm-Cluster.
The cluster is now fully visible! You are ready to launch applications with a simple click.
🔹Under the Hood: The Docker Swarm DNS Magic
Upon first launch, Portainer will ask how you want to connect to the Docker environment. For a Swarm cluster, the secret lies in using Docker’s internal DNS.
In the “Environment Wizard” screen, follow these critical steps:
- Choose environment type: Docker Swarm.
- Select connection method: Agent.
- In the Environment address field, enter the address:
tasks.agent:9001
Why use “tasks.agent” instead of an IP?
- Service Discovery: In Docker Swarm,
tasks.service_nameis a special DNS entry that returns the IPs of all containers in that service. - Automatic Scalability: When you add new nodes in the future, Swarm will automatically assign them an internal IP and register them under this name. Portainer will “see” the new servers instantly without you ever having to modify the configuration.
- Resilience: If a node goes down, the internal DNS removes that IP from the list, and Portainer continues to communicate with the rest of the cluster without interruption.
🔹Episode 2: Connecting to the Internet. Reconfiguring Cloudflare Tunnel
In this chapter, we transform our cluster from an isolated lab into a globally accessible infrastructure. We will use Cloudflare Tunnel to route secure traffic to our services without opening any ports on the router.
Why Are We Installing the Tunnel on the Proxmox Worker?
Although we have two nodes, we chose to run the cloudflared container on the virtual machine inside Proxmox (Worker – .112). The reason is simple: Survivability. Thanks to ZFS replication and Proxmox High Availability (HA), if the physical server hosting the Worker encounters a problem, it will be automatically migrated and restarted on the secondary node, restoring the internet connection without any manual intervention.
a. Preparing Cloudflare Zero Trust
- Access the Cloudflare Zero Trust dashboard -> Networks -> Tunnels.
- Create a new tunnel named
swarm-enterprise-tunnel. - Select the Docker installation method and copy only the Token (the long character string after
--token).
b. Launching the Tunnel in Swarm (Executed on Manager – .111)
We will not run a simple container, but a Docker Service. It will be attached to the swarm-public network, becoming the “front door” for all future applications. Replace [YOUR_TOKEN] with the one copied earlier:
# Creating the Cloudflare Tunnel service inside the cluster
docker service create \
  --name cloudflare-tunnel \
  --network swarm-public \
  --constraint 'node.role == worker' \
  --env TUNNEL_TOKEN=[YOUR_TOKEN] \
  cloudflare/cloudflared:latest \
  tunnel --no-autoupdate run
c. Routing Services (The “Port 9000” Strategy)
Once the tunnel appears with the HEALTHY status in Cloudflare, we can map our subdomains directly to the containers in the network. Since we are using a simplified interface (where advanced TLS settings are not exposed), we will use the most stable path:
- Public Hostname:
admin.renuka.site - Service Type:
HTTP - URL:
portainer_portainer:9000
💡 Enterprise Note & Troubleshooting: In the video demonstration, we used the local IP (192.168.1.111:9000) for a quick and universal connection. However, for an Enterprise architecture, we use the service name. Keep two critical details in mind for this to work:
- Stack Naming: In Docker Swarm, services are prefixed with the name of the stack they belong to. Thus, the correct address is
portainer_portainer, not justportainer. - Common Network: For the tunnel to “see” Portainer, you must manually add the portainer_portainer service to the swarm-public network from the Portainer interface (Services -> portainer_portainer -> Network -> Add to swarm-public).
Verifying Resilience: Failure Scenarios and Safety Nets
Our Enterprise architecture is built to survive when the inevitable happens. In a real-world environment, our Worker (.112) may become unavailable for several reasons, triggering different layers of protection:
- 1. Hardware Failure (The “Tank” goes down): The main physical server (pve1) loses power or suffers a hardware fault. This is where the effort from the series: “From Zero to a Complete Website” ( Episode 0: The Foundation. Proxmox Cluster and High Availability (HA) ) pays off: Proxmox steps in and migrates the virtual machine to the backup node (pve2) using ZFS Replication, restarting the Worker and reconnecting the tunnel in about one minute.
- 2. Operating System Level Failure: The virtual machine runs out of RAM (Out of Memory), storage reaches 100%, or Ubuntu suffers a critical crash (Kernel Panic).
- 3. Network or Service Failure: The network cable is accidentally disconnected, a firewall suddenly blocks communication, or the internal Docker Engine service stops.
In cases 2 and 3, or during the hardware transfer in case 1, the cluster’s software scheduler (Manager .111) intervenes. Because we enforced the rule --constraint 'node.role == worker', the Manager knows it is not allowed to take over the task. While the Worker is down, Swarm does not destroy the services but moves them into a Pending Queue. As soon as the Worker reports it is back online, the Manager instantly injects the services back into it.
To understand exactly how the cluster’s “brain” thinks and makes container allocation decisions based on these events, we built the interactive simulator below. Shut down the Worker to simulate an outage and launch services to see the Pending Queue in action:
Configuration Guide: The Enterprise Path in the Simulator
To understand exactly how the “safety net” we built in this episode works, configure the simulator above following these steps. This path reflects the technical reality of our cluster:
Step 1: Set the Constraint
Choose from the drop-down menu: 🟢 Worker Only (node.role==worker). This is the critical setting from our launch command. You are telling the Manager that the WordPress site needs its “ground” (the data on the Worker’s ZFS disk).
Step 2: Simulate Hardware Failure
Turn the Worker OFF. This is the moment the PVE1 physical server crashes. You will notice all active tasks disappear from the Worker.
Step 3: Launch a New Task
Press the ▶ Launch Task button. You will see the task fly directly into the Pending Queue. The Manager knows it is not allowed to run it on itself and holds it specifically for when the Worker is moved by Proxmox.
Step 4: Reconciliation (Back to Life)
Turn the Worker ON. This simulates Proxmox HA finishing the migration and starting the VM on PVE2. Watch as the task from Pending instantly “jumps” onto the Worker. Your site is back online, automatically!
Why is this the correct path? While we could let Swarm move the task to the Manager (the Spread variant), the site would fail because the Manager (.111) has no physical access to your files stored on the replicated virtual disk. Through this path, we force the software (Docker) to wait for the hardware (Proxmox), ensuring the app starts only where it has the necessary data available.
This is the secret of an Enterprise architecture: The system’s intelligent patience in the face of disaster.
🔹Episode 2.5 (Intermezzo): The Cluster Matrix. Live Visualization with Swarm Visualizer
“Until now, we have been working in the dark, sending commands into a black screen. It is time to turn on the lights and see what the ‘brain’ and ‘muscles’ of our infrastructure actually look like.”
Docker Swarm is an abstract entity. We know it exists, we know it moves containers from one node to another, but it is hard to visualize without the right tools. In this short intermezzo, we are installing a utility that transforms lines of code into live graphics.
Why do we need Swarm Visualizer?
While Portainer (Episode 1) gives us full control, Swarm Visualizer provides a spatial perspective. It is the perfect tool for understanding:
- Task Distribution: See exactly on which physical node each container has “landed.”
- Health Status: If a node goes down, you will see in real-time how the boxes (containers) disappear from it and are automatically recreated on the remaining active nodes.
- Orchestration Simulation: It is the best educational method to see how the container “swarm” operates.
Installing the Visualizer (Activation Command)
This application must run on the Manager Node (.111), as it needs direct access to the Docker communication file (docker.sock) to “read” the cluster state. Run the following command in your terminal:
# Creating the visualization service on port 8080
docker service create \
  --name=swarm-visualizer \
  --publish=8080:8080/tcp \
  --constraint=node.role==manager \
  --mount=type=bind,src=/var/run/docker.sock,dst=/var/run/docker.sock \
  dockersamples/visualizer
How to access the “Dashboard”?
Once the service has been created, no further configuration is needed in Cloudflare (as this is an internal diagnostic tool). Simply open a browser within your local network and access:
http://192.168.1.111:8080What will you see? You will see a column for each active node. Inside the columns, you will find your current containers: portainer, cloudflare-tunnel and, of course, the new swarm-visualizer.
Enterprise Tip: When you power up the Worker node (.112) in the following episodes, you will see how the Visualizer automatically adds a new column and how tasks begin to balance between the two machines.
🔹Episode 3: The Application Layer. Launching WordPress and MariaDB
In this chapter, we install the “heart” of our cluster. We aren’t just launching simple containers; we are deploying a complete Enterprise Stack. This architecture ensures that the database is entirely isolated from the internet, while the site files are protected by the ZFS replication we configured in Proxmox.
1. Preparing Storage on Worker (.112)
To ensure the site doesn’t lose data if the Worker node automatically migrates between Proxmox nodes, we map the volumes to a replicated location. Execute the following commands on the Worker node:
# Creating the folder structure on replicated storage
sudo mkdir -p /mnt/data/wordpress/html
sudo mkdir -p /mnt/data/wordpress/db
sudo chmod -R 777 /mnt/data/wordpress/
2. Launching the Stack in Portainer
In Portainer, go to Stacks -> Add Stack and define the entire infrastructure of the site. We use internal Docker DNS so that WordPress can communicate with the database without exposing any ports externally:
version: '3.8'

services:
  db:
    image: mariadb:latest
    restart: always
    volumes:
      - /mnt/data/wordpress/db:/var/lib/mysql
    environment:
      MARIADB_ROOT_PASSWORD: YourSecretRootPassword
      MARIADB_DATABASE: wordpress
      MARIADB_USER: wp_user
      MARIADB_PASSWORD: YourWPUserPassword
    networks:
      - swarm-public
    deploy:
      placement:
        constraints: [node.role == worker]

  wordpress:
    image: wordpress:latest
    depends_on:
      - db
    volumes:
      - /mnt/data/wordpress/html:/var/www/html
    environment:
      WORDPRESS_DB_HOST: wordpress_db
      WORDPRESS_DB_USER: wp_user
      WORDPRESS_DB_PASSWORD: YourWPUserPassword
      WORDPRESS_DB_NAME: wordpress
    networks:
      - swarm-public
    deploy:
      placement:
        constraints: [node.role == worker]

networks:
  swarm-public:
    external: true
3. Configuring External Access (Cloudflare Tunnel)
Now comes the most interesting part: connecting WordPress to the internet. In the Cloudflare Zero Trust dashboard, add the new route:
- Public Hostname:
www.renuka.site - Service Type:
HTTP - URL:
wordpress_wordpress:80(Following the rule: stack-name_service-name)
A major advantage of this method is that you no longer need to add A or CNAME records in the classic Cloudflare DNS panel. When you save the settings in the Tunnel, Cloudflare automatically creates the necessary DNS route. This is much more secure, as your home IP remains completely hidden.
Why is this an Enterprise solution?
This configuration transforms a simple WordPress site into a fortress:
- “Invisible” Database: MariaDB has no open ports and is not configured in the tunnel. Only WordPress can communicate with it through the internal network.
- Automatic Survival: If the Worker node fails, Proxmox migrates it to PVE2. The Tunnel reconnects, WordPress finds the database at the same hostname (
wordpress_db), and the files are there thanks to ZFS replication. - Efficiency: All traffic is encrypted through the tunnel, eliminating the need to manually manage SSL certificates on the server.
Since we have moved from LiteSpeed to a Docker architecture, we need a caching engine that works directly in RAM. To enable this “turbo” mode, add the following lines to the YAML file above, immediately below the
wordpress service (but before the networks section): redis:
image: redis:latest
networks:
- swarm-public
deploy:
placement:
constraints: [node.role == worker]After updating the Stack, install the “Redis Object Cache” plugin in WordPress and activate it. This will drastically reduce the database load, providing superior speed compared to what you had in classic control panels.
🔹Episode 4: Maintenance Tools. FileBrowser and phpMyAdmin
Once WordPress is online and functional, we need a “civilized” way to intervene under the hood. In an Enterprise architecture, we don’t want to log in via terminal (SSH) every time we need to modify a theme, an .htaccess file, or a database value.
Therefore, we will install two essential tools that will act as “service doors” to our infrastructure: FileBrowser (the web file manager) and phpMyAdmin (the interface for MariaDB).
1. Preparing Storage on the Worker (.112)
Just like the main site, these tools need physical disk space to save their own settings and internal databases. To avoid losing this data upon a potential restart, we create dedicated folders on the replicated ZFS storage. A critical detail here is manually creating the database file for FileBrowser before launching it.
We connect to the Worker (.112) node and execute:
# Creating the main configuration folders for maintenance
sudo mkdir -p /mnt/data/maintenance/filebrowser
sudo mkdir -p /mnt/data/maintenance/pma

# Creating the empty database file for FileBrowser (Critical step!)
sudo touch /mnt/data/maintenance/filebrowser/filebrowser.db

# Applying 777 permissions to allow Docker to write data
sudo chmod -R 777 /mnt/data/maintenance/
2. Launching the Maintenance Stack
A basic rule in DevOps is isolation. We won’t add these tools on top of the main application (WordPress). We will create a new Stack in Portainer, called maintenance. Why? Because if we want to free up resources (RAM) in the future, we can completely stop this stack without the public site being affected for a single second.
We navigate in Portainer to Stacks -> Add Stack and enter the following code:
version: '3.8'

services:
  filebrowser:
    image: filebrowser/filebrowser:latest
    user: 0:0 # Running with root privileges to be able to edit files created by WordPress
    volumes:
      - /mnt/data/wordpress/html:/srv
      - /mnt/data/maintenance/filebrowser/filebrowser.db:/database.db
    networks:
      - swarm-public
    deploy:
      placement:
        constraints: [node.role == worker]

  phpmyadmin:
    image: phpmyadmin:latest
    environment:
      - PMA_HOST=wordpress_db # Essential: This is how we call the database from the other stack!
      - PMA_PORT=3306
    networks:
      - swarm-public
    deploy:
      placement:
        constraints: [node.role == worker]

networks:
  swarm-public:
    external: true
3. Configuration in Cloudflare Tunnel
At this point, our containers are running but are isolated within the internal network. To access them from our browser, we use the existing tunnel we created in the previous episodes.
We go to the Cloudflare Zero Trust -> Tunnels dashboard, configure our tunnel, and add two new routes (Public Hostnames):
- File Manager:
files.renuka.site➡️ directed tohttp://maintenance_filebrowser:80 - Database:
db.renuka.site➡️ directed tohttp://maintenance_phpmyadmin:80
- File Manager:
You don’t need to manually add anything in the DNS! Cloudflare creates the routes automatically, keeping your home IP completely hidden.
4. Authentication Guide: What credentials do we use?
This is where the beauty of interconnected systems comes in. If you try to access the new addresses, you will be greeted by login screens.
A. In FileBrowser (files.renuka.site):
- Try to log in with the default credentials:
adminfor the user andadminfor the password. - Change the password immediately from the interface! Once logged in, you will have visual access to the entire WordPress
htmlfolder.
- Try to log in with the default credentials:
For security reasons, some recent versions of FileBrowser disable the “admin” password and generate a random one upon the first startup. If you cannot log in, go to Portainer under the Containers section, click the Logs icon (the sheet of paper) next to the
maintenance_filebrowser container, and there you will find the unique system-generated password. Use it for your first login!B. In phpMyAdmin (db.renuka.site):
- Here you do NOT need a newly created account! phpMyAdmin uses the database’s identity.
- You will log in with the credentials you defined in the YAML file from Episode 3:
- For full access: User
root+ Password fromMARIADB_ROOT_PASSWORD. - For limited access: User
wp_user+ Password fromMARIADB_PASSWORD.
- For full access: User
As soon as you press the “Deploy” button in Portainer, open the tab with Swarm Visualizer (the application we installed in Episode 2.5). You will see in real-time how the Docker Swarm “brain” sends the new containers exactly to the Worker node (.112), right next to WordPress. It is the absolute visual confirmation that both applications have physical access to the same ZFS disks.
Although these “doors” are now a click away, the location of your physical server remains a mystery on the internet, and entry is conditioned by solid keys.
Stay Free! Stay Hidden!
🔹Episode 5: Monitoring and Survival. Grafana (Health) and Duplicati (External Backup)
An invisible infrastructure is useless if it is fragile. In this final chapter, we close the safety circle. We will implement a visual monitoring system to track the cluster’s “pulse” in real time and, most importantly, an automated backup system to ship our precious data off the physical server (Offsite).
1. Preparing Storage and Monitoring Rules
We connect to the Worker node (.112) and execute the creation of the base directories on the ZFS replicated storage:
# Creating directories for Monitoring and Backup
sudo mkdir -p /mnt/data/monitoring/grafana
sudo mkdir -p /mnt/data/monitoring/prometheus
sudo mkdir -p /mnt/data/backups/duplicati/config

# Manually creating the Prometheus configuration file
sudo nano /mnt/data/monitoring/prometheus/prometheus.yml
In the nano editor, add this basic set of rules:
global:
  scrape_interval: 15s

scrape_configs:
  - job_name: 'prometheus'
    static_configs:
      - targets: ['localhost:9090']
Save (CTRL+X, Y, Enter) and apply global host permissions so that Docker can seamlessly write the data:
sudo chmod -R 777 /mnt/data/monitoring/
sudo chmod -R 777 /mnt/data/backups/
2. Launching the Monitoring Stack (Grafana & Prometheus)
In Portainer, we go to Stacks -> Add Stack and create a new Stack named monitoring:
version: '3.8'

services:
  prometheus:
    image: prom/prometheus:latest
    volumes:
      - /mnt/data/monitoring/prometheus:/prometheus
      - /mnt/data/monitoring/prometheus/prometheus.yml:/etc/prometheus/prometheus.yml
    command:
      - '--config.file=/etc/prometheus/prometheus.yml'
      - '--storage.tsdb.path=/prometheus'
    networks:
      - swarm-public
    deploy:
      placement:
        constraints: [node.role == worker]

  grafana:
    image: grafana/grafana:latest
    volumes:
      - /mnt/data/monitoring/grafana:/var/lib/grafana
    environment:
      - GF_SECURITY_ADMIN_PASSWORD=parola_ta_secreta_grafana
    networks:
      - swarm-public
    deploy:
      placement:
        constraints: [node.role == worker]

networks:
  swarm-public:
    external: true
3. Placing the Safety Net: Duplicati (Offsite Backup)
We create another Stack in Portainer named backups:
version: '3.8'

services:
  duplicati:
    image: linuxserver/duplicati:latest
    environment:
      - PUID=1000
      - PGID=1000
      - TZ=Europe/Bucharest
      # SETTINGS_ENCRYPTION_KEY is mandatory for securing the internal database
      - SETTINGS_ENCRYPTION_KEY=Renuka2026Backup
      # CLI_ARGS ensures access through the Swarm network and sets the initial password
      - CLI_ARGS=--webservice-interface=any --webservice-port=8200 --webservice-password=admin1234 --webservice-allowed-hostnames=*
    volumes:
      - /mnt/data/backups/duplicati/config:/config
      - /mnt/data/wordpress:/source/wordpress
      - /mnt/data/maintenance:/source/maintenance
    networks:
      - swarm-public
    deploy:
      placement:
        constraints: [node.role == worker]

networks:
  swarm-public:
external: trueMariaDB is a “live” database. If Duplicati copies the
db/ folder while the database is actively writing, the backup will be corrupted.The Solution (Dynamic Dump + Filtering):- Step 1 (Cron Job): Run
crontab -eon the Worker node and add the line for 02:50 AM:
50 02 * * * docker exec $(docker ps -q -f name=wordpress_db) mariadb-dump -u root -pParolaTaSecreta wordpress > /mnt/data/wordpress/database_backup.sql - Step 2 (Duplicati Filter): In the Duplicati interface, under Filters, choose Exclude folder and select
source/wordpress/db/.
This way, we only save the static .sql file, guaranteeing a successful restoration!
4. Access via Cloudflare Tunnel
We add the secure routes in the Cloudflare Zero Trust panel to access our new tools:
- Grafana Dashboard:
stats.renuka.site➡️http://monitoring_grafana:3000 - Backup Interface:
backup.renuka.site➡️http://backups_duplicati:8200
5. The Nightmare Scenario: Disaster Recovery (How to Restore?)
If you completely lose the physical server, the order of operations is critical to avoid write conflicts:
- Step 1 (Recovery): Install Docker on the new server, launch the
backupsstack, and restore the data into/mnt/data/wordpress. - Step 2 (Startup): Only now do you launch the
wordpressstack from Portainer. - Step 3 (Automated Injection): We execute a “one-click” script prepared on the Worker to populate the empty database:
# Creating the recovery script on the Worker node
sudo nano /mnt/data/wordpress/restore_db.sh

# Add this code (watch out for your root password!):
#!/bin/bash
docker exec -i $(docker ps -q -f name=wordpress_db) mariadb -u root -pParolaTaSecreta wordpress < /mnt/data/wordpress/database_backup.sql

# Save and grant execution permissions:
sudo chmod +x /mnt/data/wordpress/restore_db.sh
Run sudo /mnt/data/wordpress/restore_db.sh and the site instantly revives, identical to the exact moment of the last backup.
You did it! You have navigated a complex technical journey, making the leap from traditional hosting to a distributed Enterprise architecture. Your infrastructure is now a mature, agile ecosystem, completely hidden from attackers.
Stay Free! Stay Hidden! Stay Indestructible!